Flowcharts in Minutes, Not Hours: How Microsoft Visio Can Help You Impress!
Microsoft Visio
Remember how your elementary school English teacher told you to, “Show, not tell?” Turns out, this is not just a good rule to follow for creative writing assignments — it’s also the right way to stand out in the professional crowd.
Visio: Flowcharts, Processes, and Hierarchies
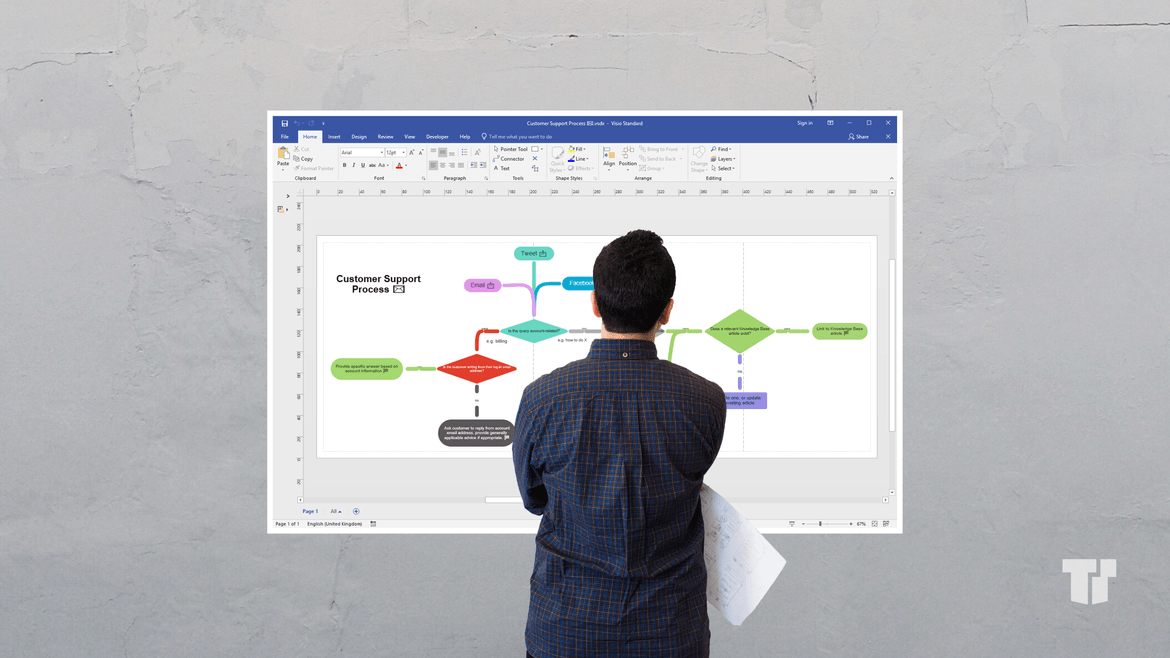
Good ideas are often complex. So, it is unlikely that your listeners will understand and agree to yours if you only explain them verbally. Humans are visual creatures. According to the Social Science Research Network, 65 percent of humans process information based on what they see. Therefore, standing in front of colleagues and customers trying to explain a complicated, step-by-step concept can often go awry — anyone who has ever experienced glazed-over expressions during a presentation can relate. This becomes especially hard when presenting DIY diagrams, hierarchies, and processes to others. It is also difficult to explain clear and concise instructions and provide enough details in a manner that makes them easily replicable in the future. Microsoft Visio is an essential software program to help you create well-structured and easy-to-follow flowcharts.

How Visio’s Features and Tools Can Help You
By using Visio’s advanced data graphics, Visio data types and Visio flow diagram symbols, you will quickly set yourself apart from the crowd. From the basic Visio flow diagram symbols (ovals, arrows, rectangles and diamonds to indicate decisions) to intermediate and advanced flowchart symbols (data symbols, input and output symbols, merging and connecting symbols and more), your flowchart will both describe in detail — and show — what you need to communicate. This versatile process-illustrating software can also be used to identify staffing needs, redundancies and potential project or product pitfalls.
Visio Advanced Data Graphics
Visio’s advanced data graphics allow you to tailor your flowchart to further set your data apart from the rest. With Visio, you can help your intended audience or readers visualize imported data and values, creatively representing the data through the use of percentages, data bars, icons, colors and shapes. For example, icon sets are a good way to show percentages, conditions and “Yes” or “No” formats. Visio’s advanced data graphics also include color shapes that are representative of underlying data, text callouts and data bars.
Getting Started with Visio Advanced Flowcharts
Getting started and implementing advanced flowcharts with Visio is as easy as selecting a template. Templates are a great way to get the feel of this software program. You can explore Visio’s advanced data graphics, Visio flow diagram symbols and Visio decisions shapes as well as familiarize yourself with Visio flowchart rules. There are over 80 templates in Visio. Many of the more popular and most frequently used Visio templates can be found under the “Featured” option. You can also browse templates by their categories, including engineering, maps and floor plans, networks and more. Create a flowchart or a process from scratch: select “Blank,” which will allow you to drag, drop and showcase the exact Visio shapes you want to illustrate your process or your point.
Trusted Tech Team is an accredited Microsoft CSP Direct Bill Partner, carrying multiple Solutions Partner designations and the now-legacy Microsoft Gold Partner competency. Based in Irvine, California, we report trends affecting IT pros everywhere.
If your organization uses Microsoft 365 or Azure, you may be eligible to receive a complimentary savings report from a Trusted Tech Team Licensing Engineer. Click here to schedule a consultation with our team now to learn how much you can save today.
Subscribe to the Trusted Tech Team Blog
Get the latest posts delivered right to your inbox

